Author Net
Author Net visualizes a net of co-author relationship based on the information collected from DBLP Bibliography Web site.
- Developers : Wei-Chung Hu
- Status : Adaptive maintenance (due to the DBLP webpage format change recently)
- Language : Python
- Thirdparty Tools : NetworkX, Pylab, BeautifulSoap, SQLObject , PySQLite
Rationale
This tool was initiated in spring 2007. At that time, DBLP only provides a complete author publication list and co-author list with paper identification numbers. The DBSE laboratory members felt trouble when trying to get a global research picture about other researchers all over the world.
For example, we are interested with Dr. L.C. Briand's research works, and would like to know who else he works with. Although the DBLP itself provides the complete publication list, it is hard for us to get the global research picture around Dr. L.C. Briand efficiently. A visitor of DBLP has to transform the data inside the publication and co-authoring table into a conceptual map in his mind.
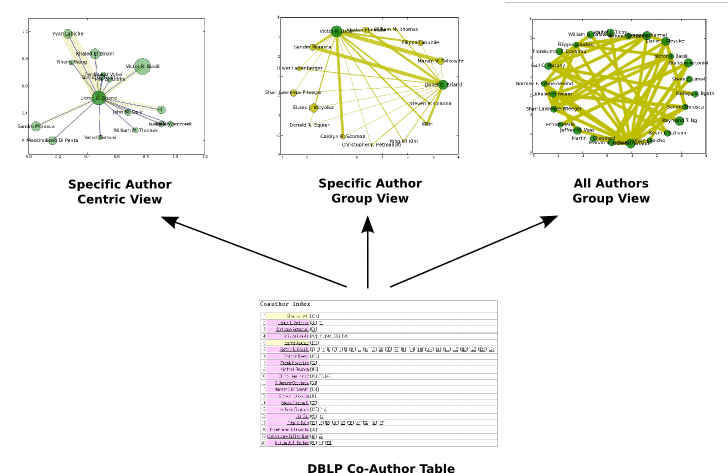
Therefore, we build this AuthorNet tool to help in visualizing the data inside publication and co-authoring table into three views we would like to see.
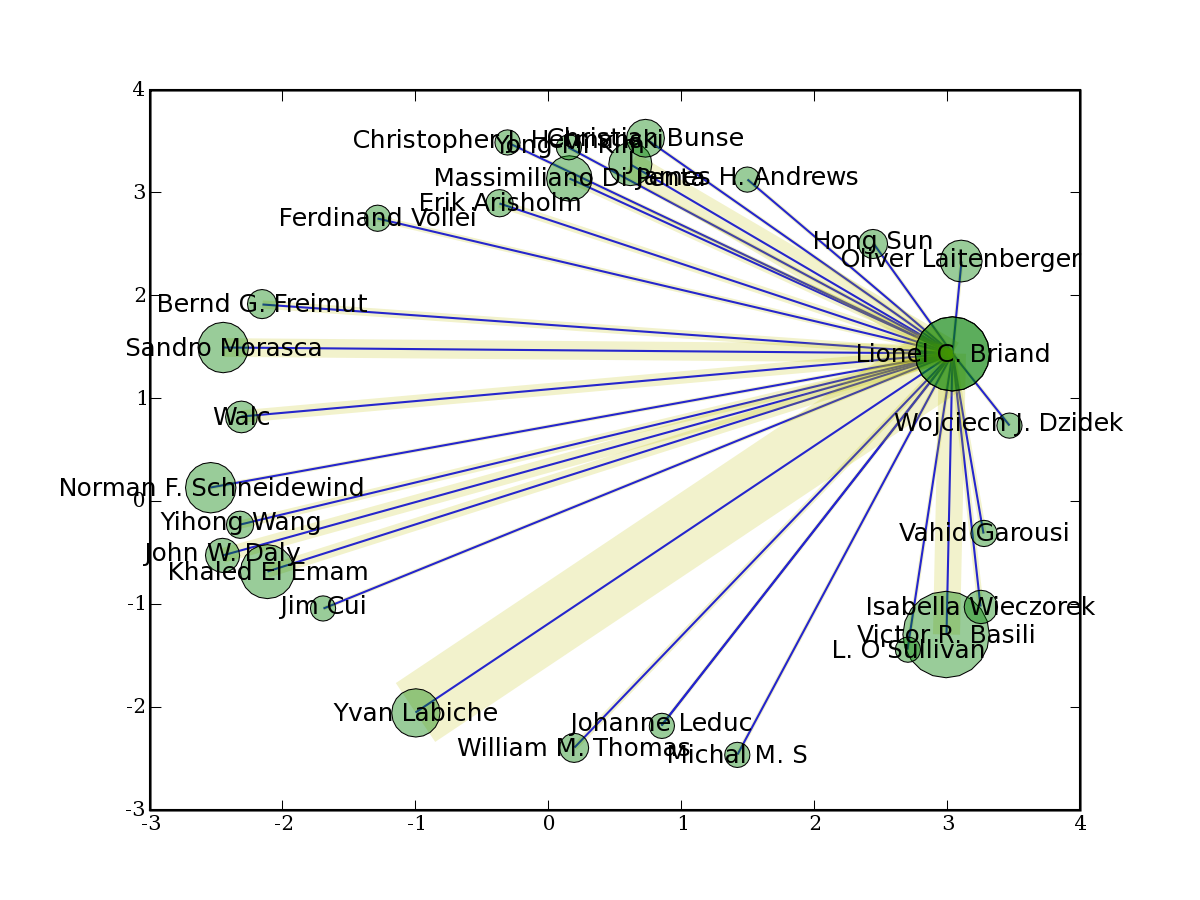
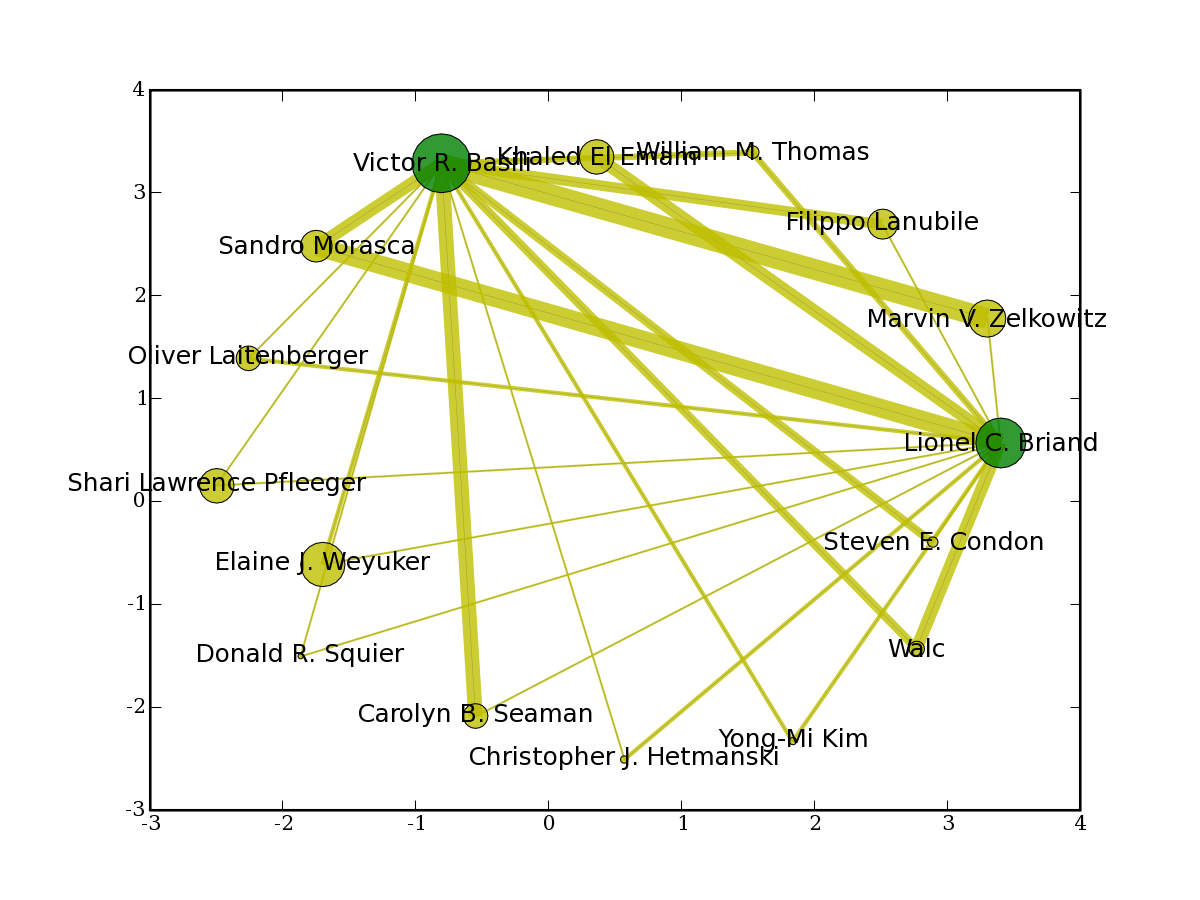
- The Specific Author Centric View : Visualizes the co-authoring information centered by Dr. L.C. Briand (for example). This view focuses on discovering the co-authoing association between Dr. L.C. Briand and other researchers. The size of green circle represents the amount of published papers. The width of yellow bar between Dr. L.C. Briand and any other co-author represents the amount of co-authored papers.
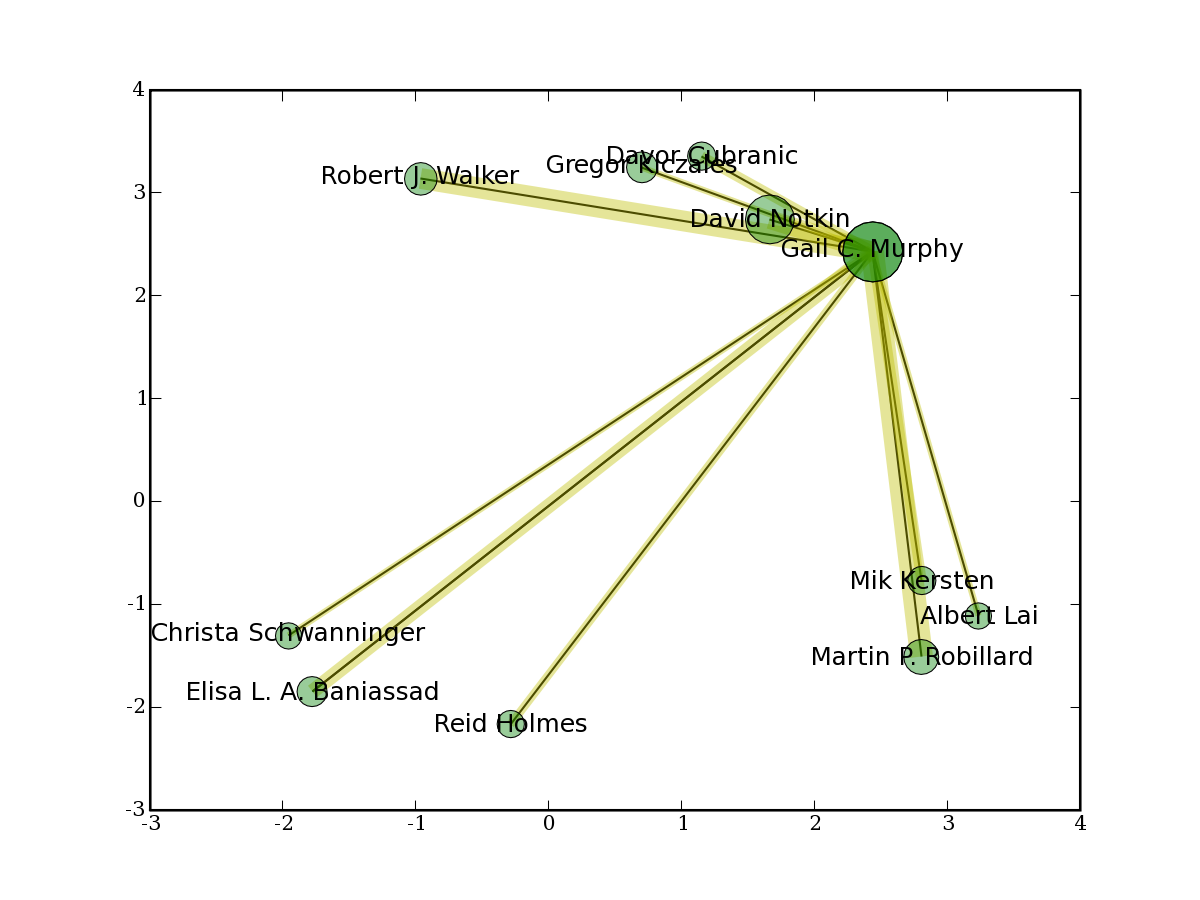
- The Specific Author Group View : Visualizes the co-authoring information between a group of researches. The researcher group includes only the co-authors of Dr. L.C. Briand (for example). Comparing to the "The Specific Author Centric View", this view further reveals the research associations between co-authors of Dr. L.C. Briand.
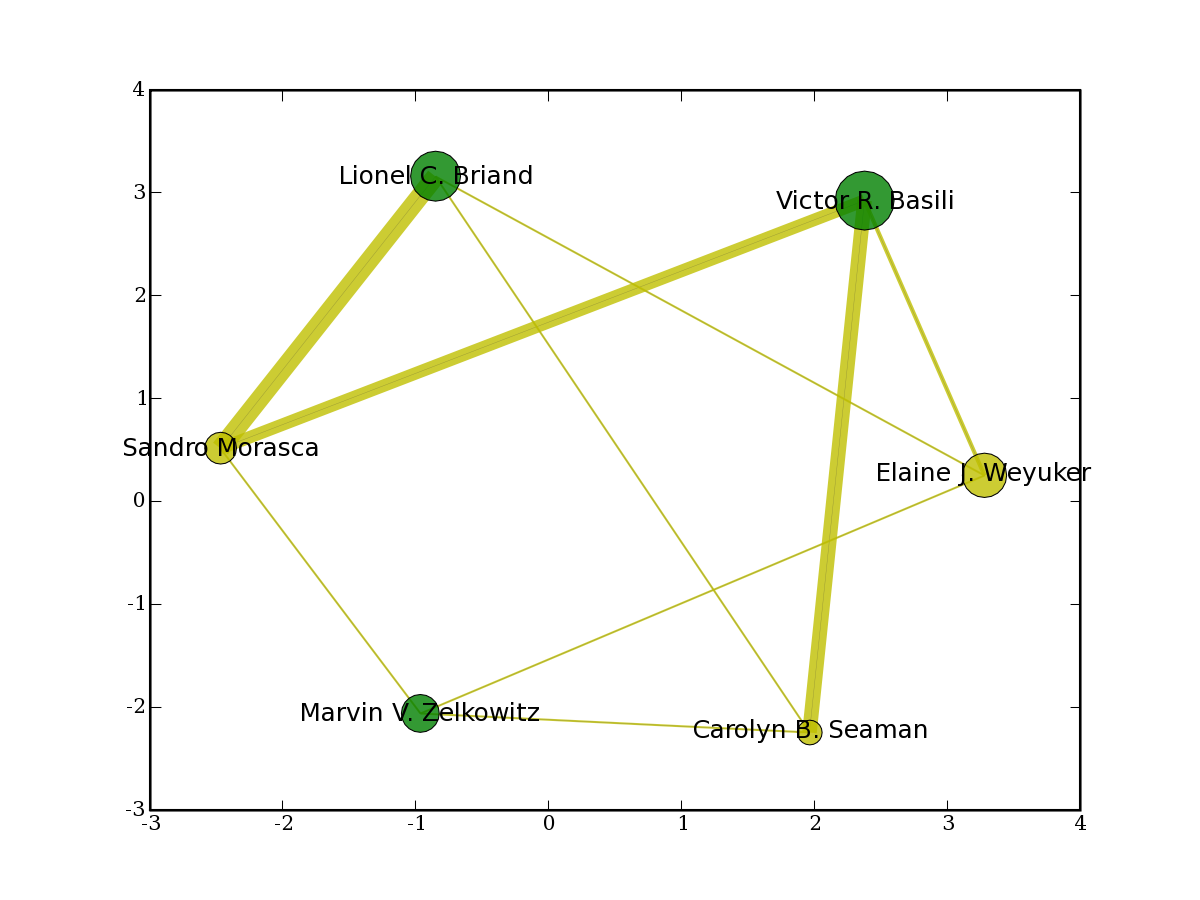
- All Author Group View : This view simply visualizes the co-authoring information between all the selected authors. That is, the users can input any set of authors, and the co-authoring diagram will be generated accordingly.
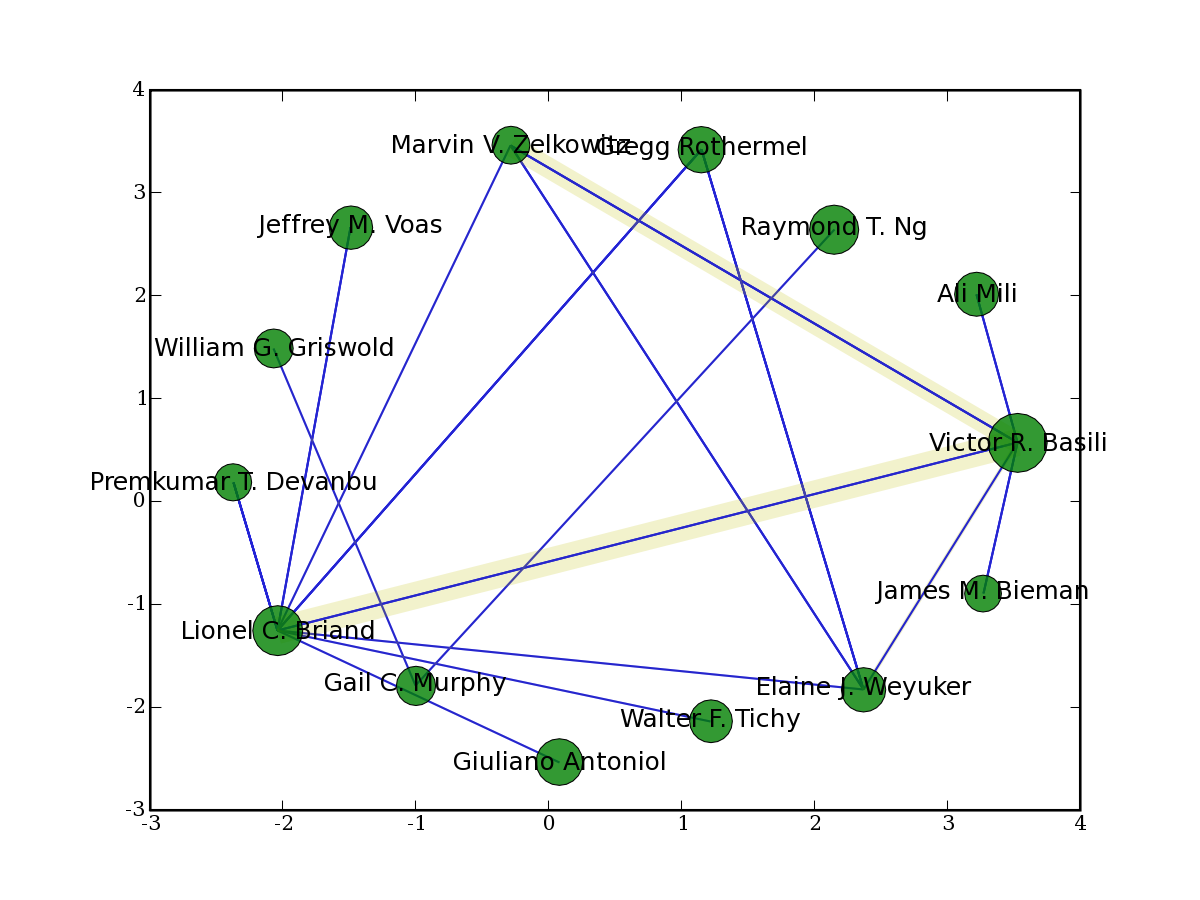
All these views can be tuned by changing the amount of publication threshold. For example, if the publication threshold is set to 10 per researcher, those authors who only have less than 10 publications will be filtered and will not be put on the diagram. See More Snapshot for illustrated examples.
Extended Usage
We are currently trying to apply AuthorNet to a more broad usage, such as discovering and visualizing the artifact co-authoring inside a software project.Downloads
- We are sorry, this tool is under adaptive maintenance due to the DBLP webpage format change recently. Not available yet.
More Snapshots